
Market analysis, Nov 17, 2026 (Tue)
KOSPI Composite · Samsung Electronics · Gold (XAUUSD) · Bitcoin (BTCUSD) daily charts
We read the KOSPI Composite, Samsung Electronics, Gold (XAUUSD), Bitcoin (BTCUSD) daily charts through moving averages and the trend-exhaustion stage, use Elliott waves to gauge the next direction, and state resistance and support levels together with the price that would invalidate the view.
KOSPI Composite daily
KOSPI Composite Daily Analysis (Nov 17, now 4,968.46, -2.59%)
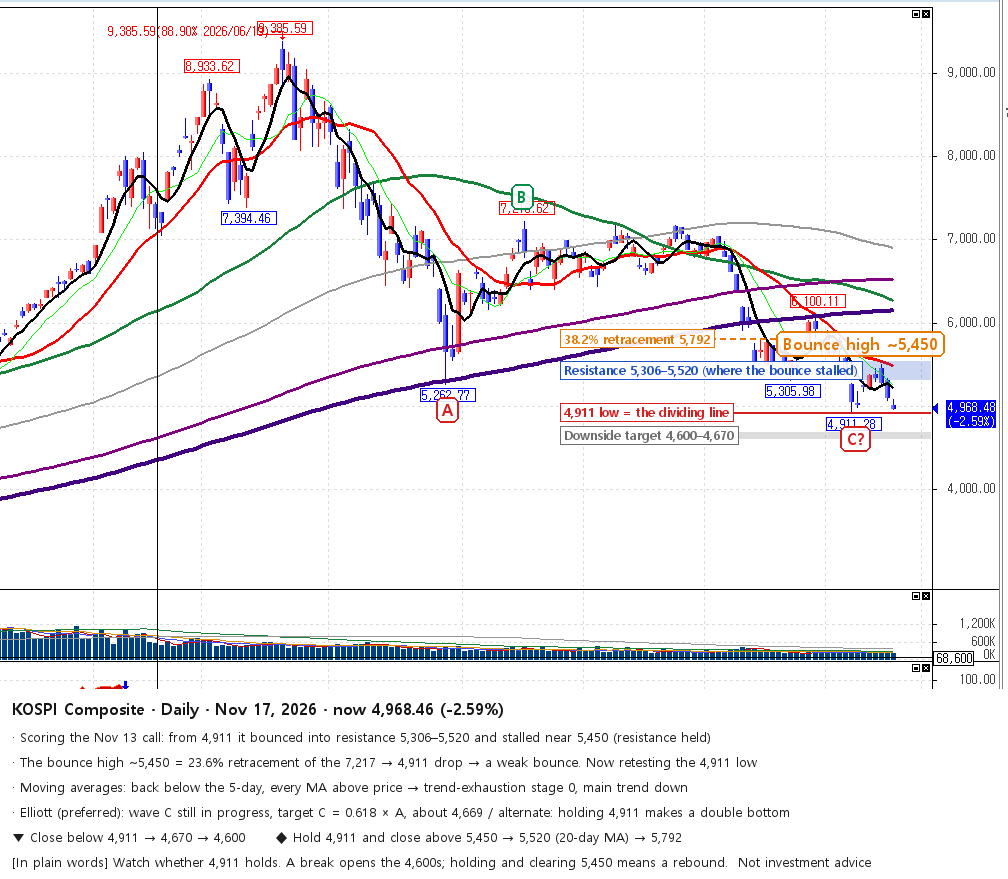
Scoring the previous call (Nov 13)
- ▲ "If 4,911 holds, a bounce into resistance 5,306–5,520" → it bounced to about 5,450 and stalled inside that zone ✅ (resistance held)
- ▼ "A close below 4,911 targets 4,600–4,670" → still above 4,911 ⏸
Moving averages
- The bounce turned down below the 20-day MA (about 5,480) and price is back below the 5-day MA
- The 60-, 120-, 200- and 240-day MAs are all above price → trend-exhaustion stage 0, the main trend is down
Price structure
- Low 4,911 → bounce high about 5,450 (lower than the early-November high of 6,100) → now retesting the low
- Holding 4,911 would make a double bottom; breaking it extends the decline
Fibonacci
- The bounce high (about 5,450) matches the 23.6% retracement (5,455) of the 7,217 → 4,911 drop
- Retracing only 23.6% means a weak bounce
- The 38.2% retracement above is 5,792
Elliott wave
- Preferred: wave C of the A-B-C correction from the June 19 high of 9,386 is still in progress; the bounce to 5,450 is a small rally inside wave C
A 5,263 / B 7,217 / C in progress → target C = 0.618 × A, about 4,669 - Alternate: if 4,911 holds, wave C has ended and a double-bottom rebound follows
- Invalidation: 4,911
Volume
- Volume keeps shrinking; no capitulation (volume spike) signal at the lows
Key levels
- 5,792 38.2% retracement
- 5,306–5,520 first resistance (October low + 20-day MA, where this bounce stalled)
- 4,911 the low = the dividing line
- 4,600–4,670 downside target (C = 0.618 × A)
Scenarios (minimum targets)
▼ Base case (with the trend): close below 4,911 → 4,670 → 4,600
◆ Double bottom: 4,911 holds and a close above 5,450 → 5,520 (20-day MA) → 5,792 (38.2%)
In plain words
- The KOSPI fell hard from its June high, bounced briefly, but the bounce was weak and the index is back near its recent low (4,911).
- If 4,911 breaks, it can fall further to 4,600–4,700.
- If it holds at 4,911 and climbs back above 5,450, a "double bottom" forms and a rebound becomes more likely.
- For now, the thing to watch is whether 4,911 holds. The big trend is still down.
Samsung Electronics daily
Samsung Electronics Daily Analysis (Nov 17, now KRW 189,800, -3.56%)
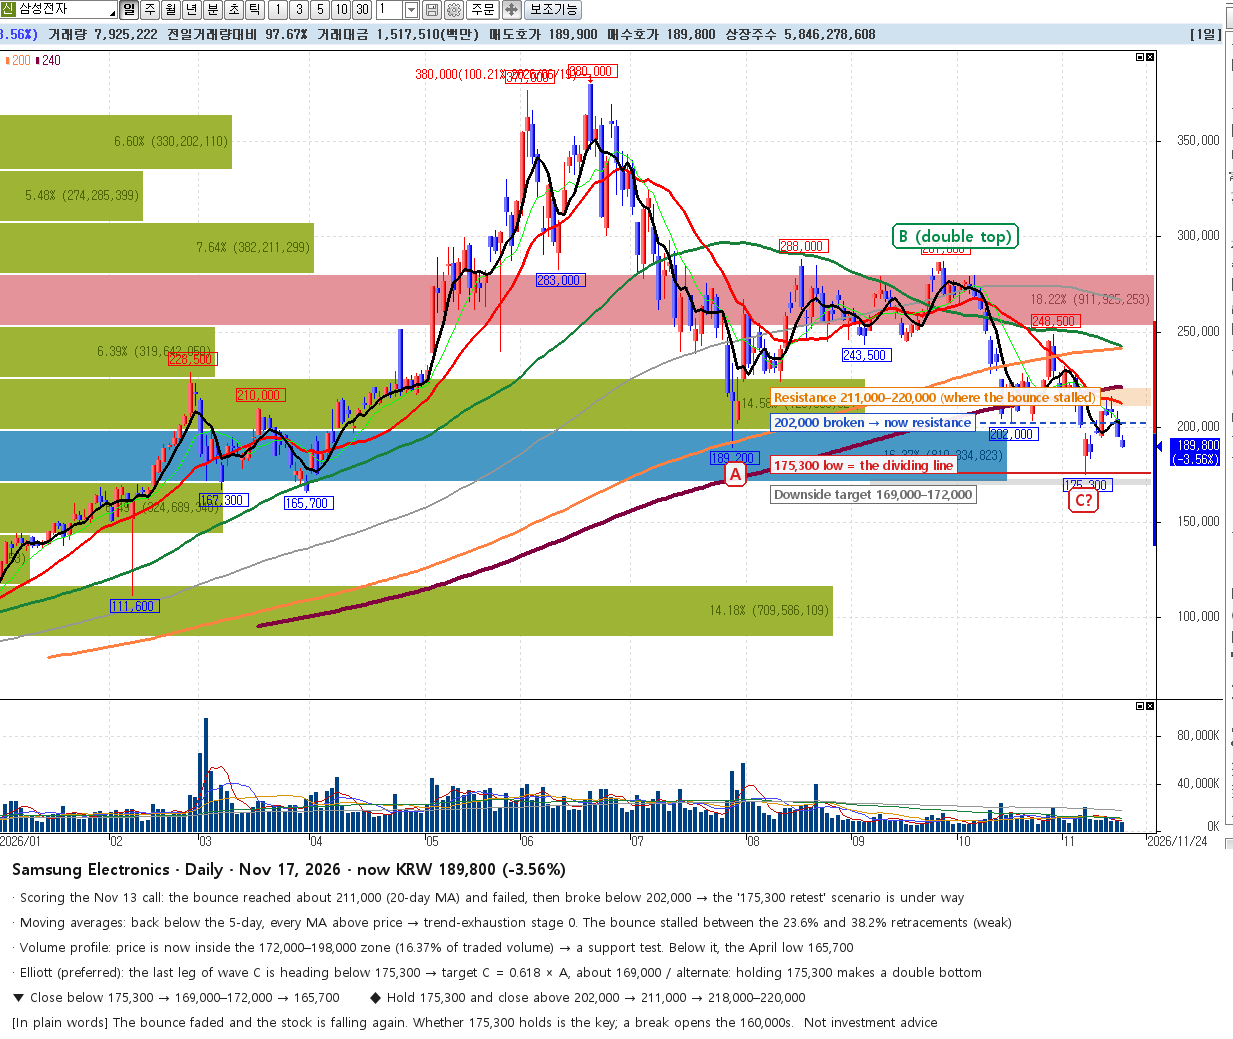
Scoring the previous call (Nov 13)
- ▲ "Higher lows above 202,000 lead to 212,000–218,000" → it bounced to about 211,000 (20-day MA) and failed ❌
- ▼ "A close below 202,000 means a retest of 175,300" → 202,000 broke and the stock is now falling toward it at 189,800 ✅ in progress
Moving averages (5 black / 20 red / 60 dark green / 120 grey / 200 orange / 240 purple)
- Back below the 5-day MA; the 20-day (about 211,000), 240-day (about 220,000) and 200/60-day (about 242,000) are all above price
- Trend-exhaustion stage 0, the main trend is down
Price structure
- Low 175,300 → bounce high about 211,000 → falling again; the late-October low of 202,000 is now resistance
- Holding 175,300 would make a double bottom; breaking it extends the decline
Fibonacci (October high 287,000 → November low 175,300)
- The bounce high (about 211,000) sits between the 23.6% (201,700) and 38.2% (218,000) retracements → a weak bounce
- The 38.2% level (218,000) lines up with the 240-day MA (about 220,000) as resistance
Volume profile
- Price has entered the 172,000–198,000 zone (16.37% of traded volume, the largest zone below) → a support test
- Below that is the April low of 165,700; above, 255,000–280,000 is the largest overhead supply zone (18.22%)
Elliott wave
- Preferred: in the A-B-C correction from 380,000, the last leg of wave C is under way; the bounce to 211,000 was a rally inside wave C
A 189,200 / B 288,000 & 287,000 double top / C in progress → target C = 0.618 × A, about 169,000 - Alternate: if 175,300 holds, wave C has ended and a double-bottom rebound follows
- Invalidation: 175,300
Volume
- Today 7.93 million shares, 97.7% of the previous day → selling with steady volume, but no capitulation spike
Key levels
- 211,000–220,000 resistance (20-day MA + bounce high + 38.2% + 240-day MA)
- 202,000 broken support → now resistance
- 175,300 the November low = the dividing line
- 169,000–172,000 downside target (C = 0.618 × A + lower edge of the volume zone)
- 165,700 the April low
Scenarios (minimum targets)
▼ Base case (with the trend): close below 175,300 → 169,000–172,000 → 165,700
◆ Double bottom: 175,300 holds and a close above 202,000 → 211,000 → 218,000–220,000
In plain words
- Samsung bounced from its November low (175,300) but stalled near 210,000 and is falling again.
- Price is now in a zone where a lot of shares changed hands before (the 170,000s–190,000s), so whether it holds here matters.
- If 175,300 breaks, it can fall further into the 160,000s.
- If it holds at 175,300 and climbs back above 202,000, a "double bottom" forms and a rebound becomes more likely.
- The big trend is still down, so rather than assuming "it has fallen a lot, it must bounce", watch which comes first: a break of 175,300 or a close above 202,000.
Gold (XAUUSD) daily
Gold (XAUUSD) Daily Analysis (Nov 17, now 3,869.4)
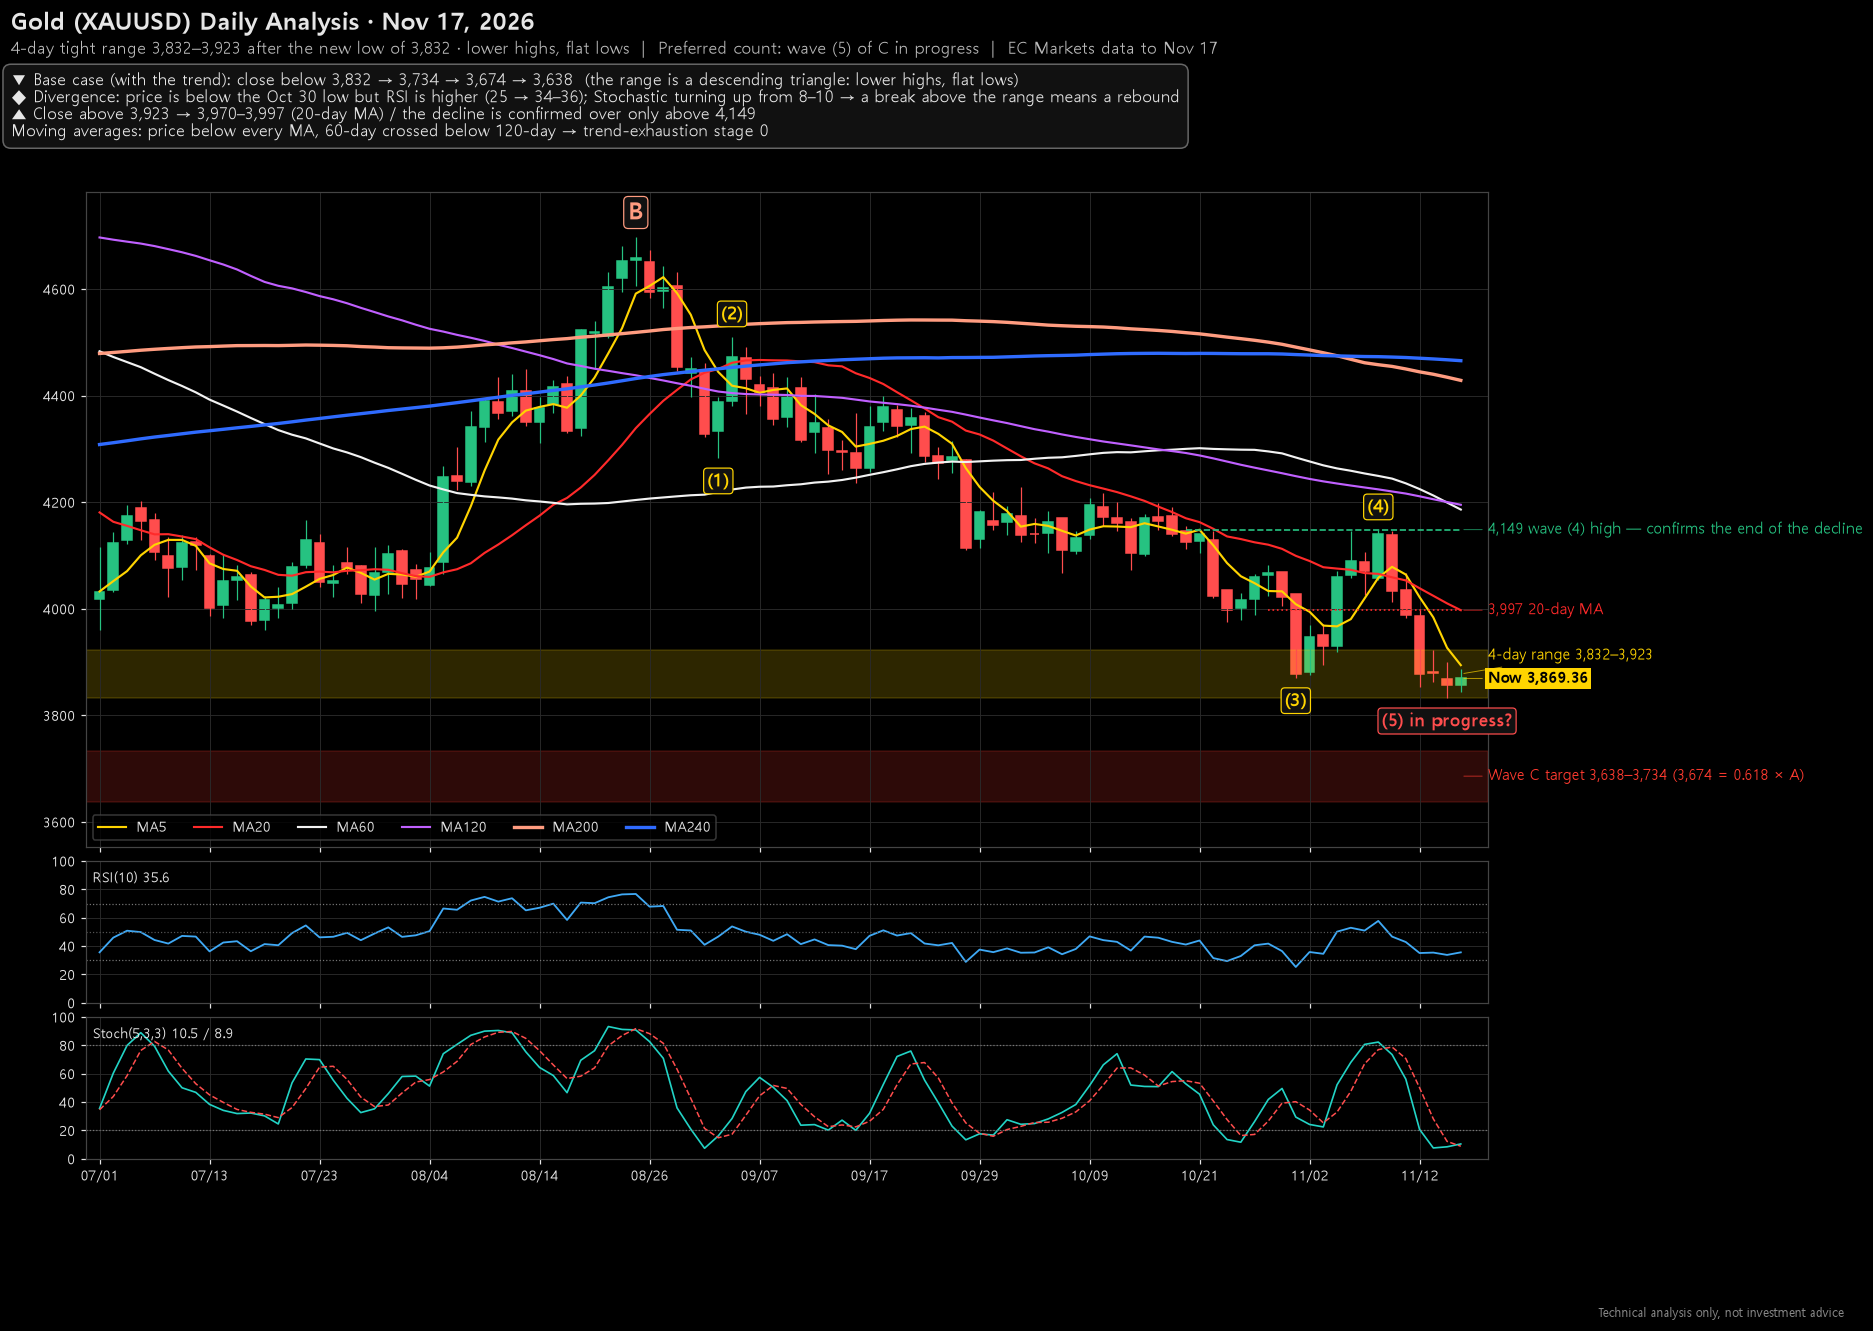
Scoring the previous call (Nov 14)
- ▼ "A close below 3,853 targets 3,734 → 3,674" → On Nov 16 gold hit a new low of 3,832.4 intraday but closed at 3,856.3 → the closing condition did not trigger ⏸
- ◆ "A close above 3,990 means a rebound" → high was 3,923.1 → not triggered ⏸
- Neither scenario has been decided yet. Day 4 inside a tight 3,832–3,923 box
Moving averages (5 yellow / 20 red / 60 white / 120 purple / 200 pink / 240 blue)
- Price is below every MA: 5-day 3,894↓ / 20-day 3,997↓ / 60-day 4,186↓ / 120-day 4,195↓ / 200-day 4,429↓ / 240-day 4,466↓
- The 60-day MA crossed below the 120-day MA this week (death cross)
- Trend exhaustion stage 0; the downtrend is intact
Price structure
- 4-day box 3,832–3,923
- Highs are falling 3,923 → 3,901 → 3,887; lows are nearly flat 3,852.6 → 3,832.4 → 3,843.6
- A flat bottom with a pressed-down top forms a descending triangle; inside a downtrend these often break downward
Elliott wave
- Primary count: the final wave (5) of wave C is in progress
(1) 4,282.6 → (2) 4,510.8 → (3) 3,870.2 → (4) 4,148.6 → (5) in progress; the current box is a pause inside wave (5) - Wave (5) target 3,638–3,734 (centre 3,674 = 0.618 × wave A)
- Alternative: wave (5) ends shortly near 3,832 (RSI divergence)
- Confirmation that the decline is over: a close above 4,149 (the wave (4) high)
Momentum
- RSI(10) 35.6: price is lower than on Oct 30, yet RSI is higher than the 25 it showed then → bullish divergence continues (selling pressure fading)
- Stochastic 10.5 / 8.9: starting to cross up from the bottom zone
Volume
- Recently 290k–430k, close to the 20-day average of about 410k
- No capitulation volume spike, which is common at bottoms → volume does not yet confirm a bottom
4-hour chart
- Price is squeezed between the 5-line (3,865) and 20-line (3,886)
- Since 3,832, lows are edging higher and highs lower, converging
- If it rebounds, the 4-hour 60-line (about 4,000) and 240-line (about 4,095) are resistance
Key prices
- 4,149 wave (4) high, the line that confirms the decline is over
- 3,970–3,997 20-day MA, first rebound target
- 3,923 top of the box
- 3,832 bottom of the box = lowest of the year
- 3,638–3,734 wave C target zone
Scenarios (minimum targets)
▼ Base case (with the trend): a close below 3,832 → 3,734 → 3,674 → 3,638
▲ Rebound: a close above 3,923 → 3,970–3,997. Until 4,149 is cleared, it is only a bounce within a downtrend
Plain-English summary
- Gold has been falling for months and has rested for 4 days in a narrow range (3,832–3,923) near the lowest level of the year.
- A close below 3,832 would extend the decline toward roughly 3,700.
- A close above 3,923 could bounce toward 4,000, but until 4,149 is cleared it is only a short bounce inside a large decline.
- Now is a time to wait and see which of 3,832 or 3,923 breaks first rather than guess the direction. Because the big trend is down, betting against it with "it has fallen a lot, so it must rise" is risky.
Bitcoin (BTCUSD) daily
Bitcoin (BTCUSD) Daily Analysis (Nov 17, now 64,943)
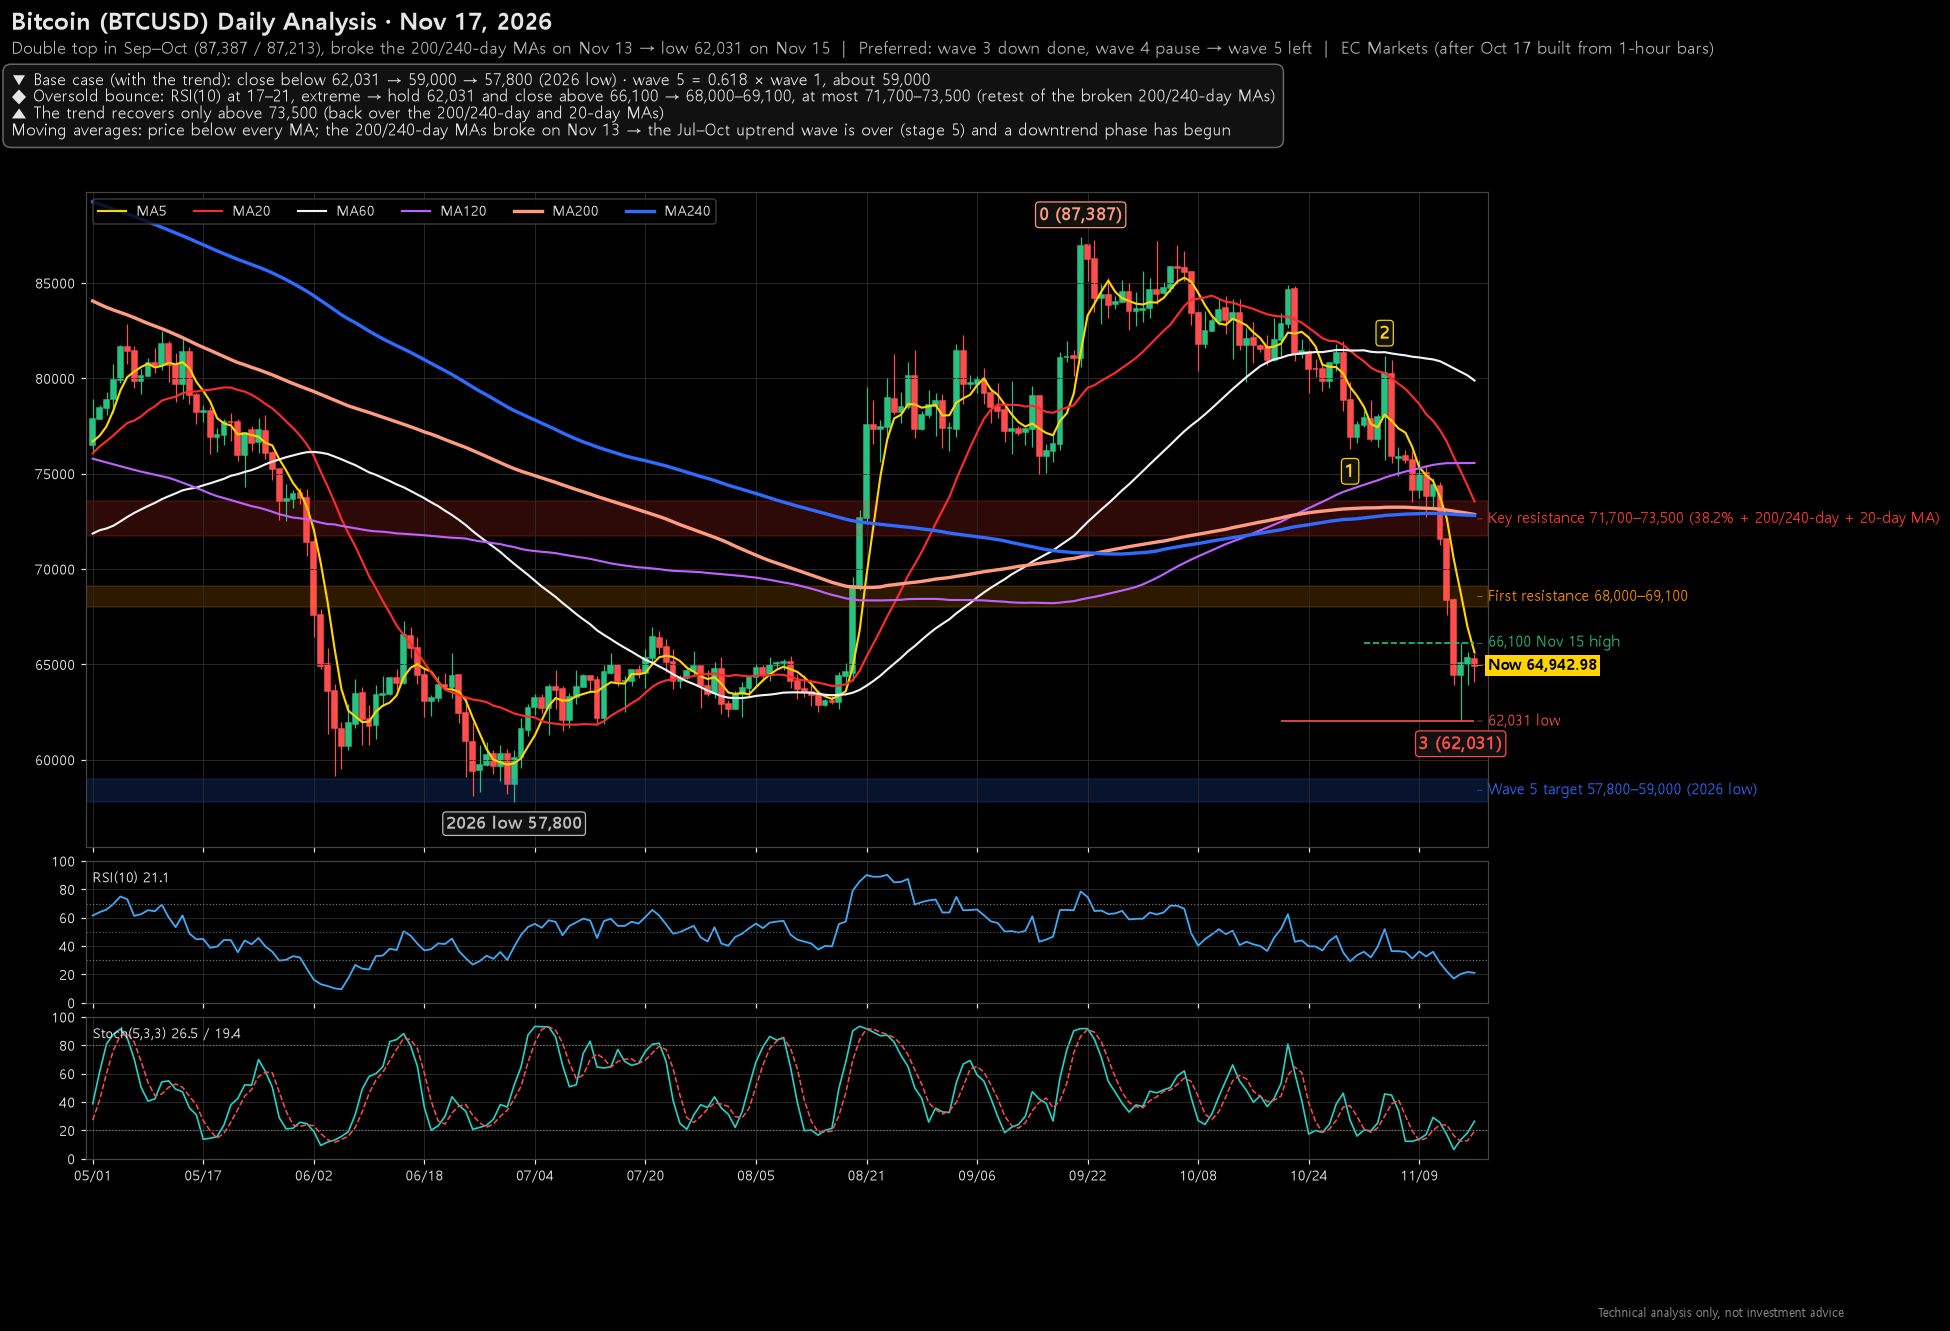
The picture
- After the all-time high of 126,208 (Oct 2025), a long decline to the 2026 low of 57,800 on Jul 1
- August surge → highs of 87,387 (Sep 21) and 87,213 (Oct 2): a double top
- 76,316 on Oct 30 → bounce to 81,181 on Nov 4 → sharp drop Nov 12–14 → low 62,031 on Nov 15, now in the 64,000s–65,000s
Moving averages (5 yellow / 20 red / 60 white / 120 violet / 200 pink / 240 blue)
- Price is below every MA: 5-day 65,625 / 20-day 73,546 / 120-day 75,562 / 60-day 79,888 / 200-day 72,862 / 240-day 72,816
- A long red candle broke the 200/240-day MAs (about 72,800) on Nov 13 → they now act as resistance overhead
Trend-exhaustion stage (Jul–Oct uptrend)
- 5-day broke → new high failed (87,213 < 87,387) → 20-day broke and the recovery failed (the Nov 4 bounce stalled at it) → 60-day broke → even the 200/240-day broke
- All five stages are done: the Jul–Oct uptrend wave is over and a downtrend phase has begun
Elliott wave
- Preferred: an impulse down from 87,387
wave 1 76,316 / wave 2 81,181 (44% retracement) / wave 3 62,031 (about 1.7 × wave 1, the longest and steepest) / now a wave 4 pause - Wave 5 target: 0.618 × wave 1 ≈ 59,000, with the 2026 low of 57,800 below → 57,800–59,000
- Wave 4 cannot enter wave 1's territory (76,316) → the absolute cap for a wave 4 bounce is 76,316
- Alternate: the decline (A-B-C) ended at 62,031 and a large rebound starts (supported by the extreme oversold RSI)
Momentum
- RSI(10) 17–21: the deepest oversold reading of the year (similar to the July low)
- Stochastic 26.5 / 19.4: turning up from the bottom
- An oversold bounce can come at any time, but oversold readings right after a trend break can last
Fibonacci
- 78.6% retracement of the Jul–Sep rally (57,800 → 87,387) is 64,132 ← around today's price
- Retracements of the drop (87,387 → 62,031): 23.6% 68,015 / 38.2% 71,717 / 50% 74,709
Volume
- This broker's BTC volume is almost identical every day (about 340k), so it is not used here
Key levels
- 71,700–73,500 key resistance (38.2% + broken 200/240-day MAs + 20-day MA)
- 68,000–69,100 first resistance (23.6% + 61.8% of the rally + the Nov 13 close)
- 66,100 Nov 15 high
- 62,031 Nov 15 low
- 57,800–59,000 wave 5 target (2026 low)
Scenarios (minimum targets)
▼ Base case (with the trend): close below 62,031 → 59,000 → 57,800
◆ Oversold bounce (wave 4): hold 62,031 and close above 66,100 → 68,000–69,100, at most 71,700–73,500 (retest of the broken 200/240-day MAs)
▲ The trend recovers only on a close above 73,500 (back over the 200/240-day and 20-day MAs)
In plain words
- Bitcoin was rejected twice around 87,000 in Sep–Oct and then fell hard, down to 62,000 within a week.
- It also broke its long-term average (about 73,000), so the big trend has turned down.
- Indicators say it has fallen too far too fast, so a bounce toward 68,000 can come, but below 73,000 that is "a bounce inside a decline".
- If 62,000 breaks, the way is open to this year's low near 58,000.
- Rather than rushing in or out, watch whether 62,031 holds and whether price clears 66,100.
* For reference only; not a recommendation to buy or sell any instrument. Investment decisions and responsibility rest with the investor.